
Power BI vs Excel: Which Tool Should You Learn First in 2026?
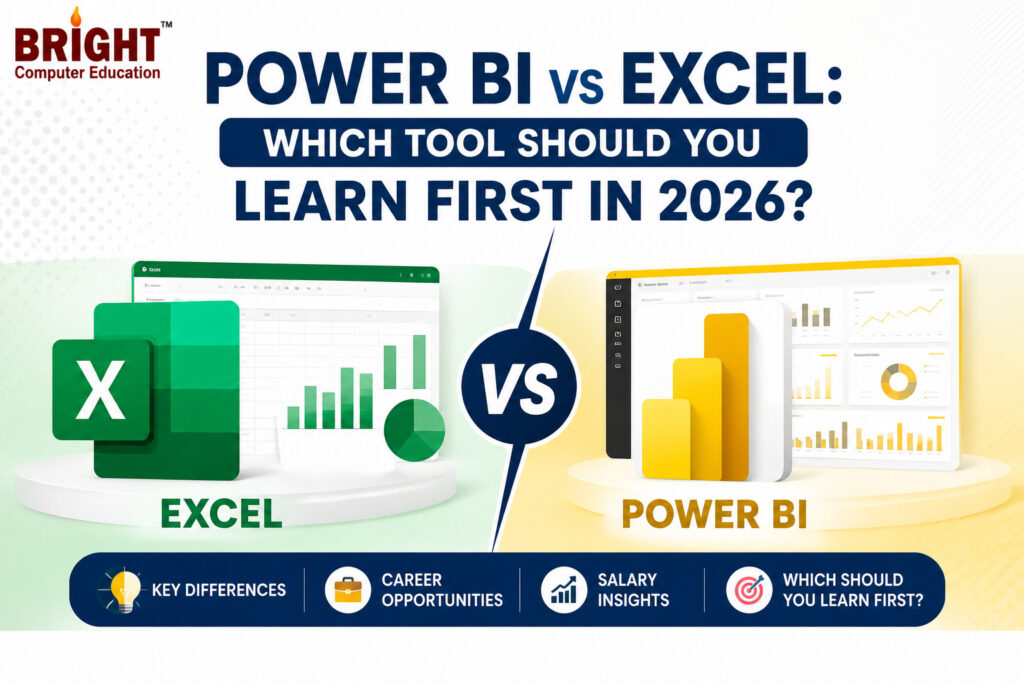
Why This Choice Matters in 2026
What Excel Really Is (Beyond Just “Spreadsheets”)
Excel is usually the first data tool people touch. You might already know some basics like rows, columns, and simple formulas. But Excel is much more than that.
With Excel, you can:
- Organize data in tables and sheets.
- Use formulas for calculations (SUM, AVERAGE, IF, VLOOKUP, INDEX–MATCH, and so on).
- Build pivot tables to summarize and explore data.
- Create charts and simple dashboards for reports.
- Use power query excel to clean, transform, and combine data from different sources.
When people talk about excel bi (Excel for business intelligence), they usually mean using pivot tables, Power Query, and sometimes Power Pivot to create analysis dashboards inside Excel itself.
In short: Excel is your everyday data workhorse. It’s excellent for ad‑hoc analysis, smaller datasets, and flexible, cell‑by‑cell work.
What Power BI Really Is (Beyond Just “Fancy Charts”)
Power BI is a dedicated business intelligence tool. Microsoft designed it specifically to handle larger datasets, build interactive dashboards, and share insights across teams.
With Power BI, you can:
- Connect to multiple data sources (databases, cloud services, Excel files, APIs).
- Use Power Query (also similar to power query excel) to clean and transform data.
- Build data models with relationships between tables.
- Use DAX (Data Analysis Expressions) to create measures and calculations.
- Design interactive dashboards with visuals that update when you filter or slice data.
- Publish those dashboards online so managers and teams can access them anytime.
Compared to Excel, Power BI is less about typing into cells and more about building a proper data model and visual experience. It shines when:
- Data is large (millions of rows).
- Many people need to see the output regularly.
- You need refreshable, automated reporting.
Power BI vs Excel: What’s the Real Difference?
Instead of thinking “power bi vs excel, who wins?” think of them as two tools in the same toolbox. Each has strengths:
- Excel is perfect for:
- Small to medium data.
- Quick, manual analysis.
- Finance modeling and “what‑if” scenarios.
- Learning basic data skills.
- Power BI is perfect for:
- Dashboards that multiple people use.
- Automated refresh and scheduled reports.
- Large datasets and more complex data models.
- Modern business intelligence and KPI tracking.
Excel lets you control every cell. Power BI encourages you to think in terms of tables, relationships, and measures. They are connected, especially through power query excel and Power Query in Power BI, but they’re not duplicates.
Power BI or Excel: Which Should You Learn First in 2026?
Here’s the human answer:
If you’re a complete beginner or still building your base, learn Excel first, then Power BI.
Why Excel first?
- The concepts are simpler and show up in everyday work: formulas, tables, charts.
- You’ll get comfortable with data itself: cleaning, filtering, summarizing.
- Many internships, entry‑level roles, and college projects expect Excel.
Once you’re comfortable with Excel, learning Power BI will feel much more natural. You’ll recognize Power Query concepts and understand what a column, a table, and a relationship mean, which makes “excel power bi” skills much easier to pick up.
Why Power BI next?
- It moves you into the business intelligence space.
- It prepares you for roles where dashboards and KPIs matter—especially in data, analytics, and reporting careers.
- It gives you confidence with more “professional” BI tools used widely in organizations.
So in a “power bi vs excel” learning timeline:
- Excel basics → formulas, tables, charts.
- Excel BI → pivot tables, basic dashboards, power query excel.
- Power BI → data modeling, visuals, DAX, publishing reports.
Power Query Excel: Your Sneaky Bridge to Power BI
Here’s a trick many people don’t realize: power query excel is an amazing bridge between Excel and Power BI.
Power Query in Excel lets you:
- Import data from different files, folders, and sources.
- Clean and transform data with a step‑by‑step editor.
- Refresh queries when source data changes.
Power Query in Power BI works nearly the same way. So if you learn power query excel properly, you’ve quietly prepared yourself to move into Power BI’s data preparation layer.
When you’re already comfortable using Power Query in Excel, opening Power BI will feel less like a new universe and more like an upgraded version of what you know.
Excel BI: How Far Can You Go Without Power BI?
You can do quite a lot using excel bi skills alone, especially if your data isn’t massive. With Excel BI you can:
- Build pivot table‑based dashboards.
- Use slicers and timelines for interactive filtering.
- Connect to external data with Power Query.
- Do basic modeling with Power Pivot (if enabled).
For many small teams or student projects, excel bi is enough. You might only hit its limits when:
- Your data grows too large (approaching Excel’s row limits).
- You need more advanced visuals.
- You want sharing that doesn’t rely on emailing files.
That’s when Power BI starts looking more attractive.
The Definitive Guide to DAX (In Human Terms)
You mentioned “the definitive guide to dax.” If Power BI were a car, DAX would be the engine that lets you go from “basic driving” to “real performance.”
DAX (Data Analysis Expressions) is the formula language used in:
- Power BI.
- Power Pivot (Excel).
We won’t write complex formulas here, but let’s talk about what DAX does in everyday language.
What DAX Is For
DAX is used to create:
- Measures (like total sales, average discount, year‑to‑date revenue).
- Calculated columns (like profit = revenue – cost).
- Time intelligence calculations (like comparing this month vs last month).
It lets you go beyond simple sums and averages and ask more intelligent questions of your data.
Why DAX Feels Different from Excel Formulas
If you’re comfortable in Excel, DAX will feel familiar but…also different.
- Excel thinks cell by cell.
- DAX thinks in terms of context: rows, filters, relationships.
That means a DAX formula might give different results depending on what filters are applied, what visual it’s used in, and what tables it’s connected to.
How to Approach Learning DAX
To build a human‑friendly connection with DAX:
- Understand your data model first.
- Which tables exist?
- How are they related?
- Start with simple measures.
- Total values, basic averages.
- Then try time‑related measures.
- Current month vs previous month.
- Year‑to‑date.
- Gradually explore more advanced functions.
Don’t try to swallow “the definitive guide to dax” all in one sitting. Learn DAX in layers, based on problems you’re actually trying to solve.
Practical Learning Path: Excel → Power Query → Power BI → DAX
If you’re wondering how to structure your learning in 2026, here’s a simple roadmap:
- Excel basics
- Formulas (SUM, AVERAGE, IF, VLOOKUP/XLOOKUP, INDEX–MATCH).
- Tables and basic charts.
- Sorting, filtering, conditional formatting.
- Excel BI and power query excel
- Pivot tables and pivot charts.
- Slicers and timelines.
- Power Query to import and clean data.
- Power BI fundamentals
- Connecting to Excel and other data sources.
- Transforming data in Power Query.
- Building simple dashboards with visuals.
- DAX essentials
- Simple measures for totals, averages, and basic logic.
- Time intelligence (month‑over‑month, year‑to‑date).
- Combining DAX with your data model to answer real business questions.
- Excel Power BI combo
- Use Excel for ad‑hoc analysis and quick checks.
- Use Power BI for official dashboards, KPIs, and organizational reporting.
Following this path, “power bi vs excel” stops feeling like a debate and starts feeling like a partnership.
How to Decide Where You Should Start
So, in 2026, which should you learn first: power bi or excel?
Ask yourself:
- Am I very new to data and office tools?
- Start with Excel. Build comfort. Then move into Power BI.
- Do I already know Excel fairly well and want to move into BI?
- Start exploring Power BI. Use your Excel knowledge as a base.
- Am I aiming for a career in data analytics, reporting, or BI development?
- Aim to know both: excel bi and Power BI with DAX.
Learning Excel first doesn’t mean you’re “stuck in the past.” It means you’re building a strong foundation. Learning Power BI after that means you’re stepping into the future of business intelligence.