

Data Analytics Projects for Beginners: 10 Practical Ideas
Data Analytics Projects for Beginners: 10 Practical Ideas
Data analytics projects for beginners are the fastest way to turn classroom concepts into skills an employer can see. A certificate says you attended; a finished project shows you can open a messy file, ask a sensible question and answer it with numbers. This guide gives you 10 practical project ideas, the tools each one needs, and a clear way to present your work.
If you are searching for a data analytics course in Vadodara, you have probably noticed that every institute lists the same tools: Excel, SQL, Python and Power BI. What separates candidates in an interview is not the list of tools, but what they built with them. A hiring manager at a Vadodara manufacturing unit, pharma company or IT services firm will rarely ask you to define a pivot table. They will ask, “Show me something you analysed.”
Why Projects Matter More Than Theory
Beginners often spend months watching tutorials and still feel stuck on their first real dataset. That is normal. Tutorials hand you clean data and a known answer. Real data arrives with missing values, inconsistent spellings and no instructions.
Working on projects teaches you three things that lectures cannot:
- Problem framing. You learn to turn a vague request (“why are sales down?”) into a testable question.
- Data handling. You spend most of your time cleaning and checking data, which is exactly what working analysts do.
- Communication. A chart nobody understands is a failed chart. Projects force you to explain findings in plain language.
In Vadodara, the demand for these skills comes from a varied base of employers: chemical and petrochemical plants, pharmaceutical and engineering companies, banks and NBFCs, ed-tech and IT firms, and a growing number of small businesses that have started tracking sales digitally. At Bright Computer Education, we build data analytics training around hands-on practice with business-style data, because that is what interviewers ask about.
Before You Start: Tools, Data and a Simple Workflow
You do not need expensive software to begin. Every project in this list can be done with free or low-cost tools.
Tool | What you use it for | Good for beginners because |
|---|---|---|
Microsoft Excel | Cleaning, pivot tables, quick charts | Most offices already use it |
SQL (MySQL or PostgreSQL) | Pulling and summarising data from tables | Almost every analyst job asks for it |
Python (pandas, matplotlib) | Cleaning large files, exploration, charts | One script can repeat the same work on new data |
Power BI Desktop | Interactive dashboards | The free desktop version is enough to learn |
Google Sheets | Sharing and collaborating | Works in a browser, no installation |
Where to find practice data. Kaggle and the UCI Machine Learning Repository host thousands of free datasets. For Indian context, the government’s Open Government Data (OGD) Platform at data.gov.in publishes datasets on agriculture, health, transport, education and more. Always read the licence and the column descriptions before you use a dataset, and credit the source in your write-up.
A workflow you can reuse on every project:
- Write the business question in one sentence (for example, “Which product category lost the most revenue in the last quarter?”).
- Collect the data and note where it came from.
- Inspect it: row count, column types, missing values, duplicates.
- Clean it and record every change you make.
- Explore: summaries, groupings, simple charts.
- Build the final output, such as a dashboard, a short report or a notebook.
- State your findings in three or four plain sentences, then add one recommendation.
10 Practical Data Analytics Projects for Beginners
The first five projects focus on core tools and a single clear skill each. Start here if you are new to data.
Project 1: Sales Performance Dashboard in Excel
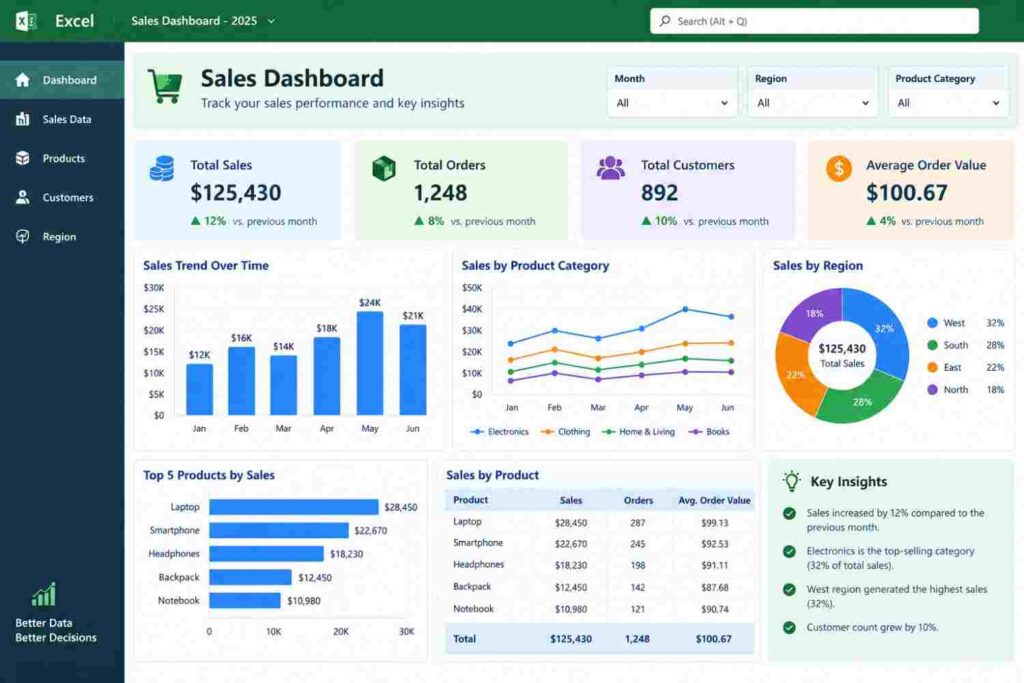
What you build: a one-page dashboard showing monthly sales, top products, and sales by region for a retail business.
Data: a free retail sales sample from Kaggle, or a small made-up dataset of a clothing shop with 12 months of invoices.
Steps: clean the date and price columns, build a pivot table for sales by month, add a second pivot for sales by product category, then insert charts and slicers.
Show in your portfolio: a screenshot of the dashboard and a short note answering, “Which two months need a promotion?”
Tip: keep the dashboard to one screen. If a manager has to scroll, it is too busy.
Project 2: Customer Orders Analysis with SQL
What you build: a set of SQL queries that answer ten business questions about customers, orders and products.
Data: an e-commerce orders dataset split into three tables (customers, orders, products).
Steps: load the tables into MySQL or PostgreSQL, practise joins, then write queries using GROUP BY and ORDER BY. A typical query looks like this:
SELECT p.category, SUM(o.quantity * p.price) AS revenue
FROM orders o
JOIN products p ON o.product_id = p.product_id
GROUP BY p.category
ORDER BY revenue DESC
LIMIT 5;
Questions to answer: Which five categories earn the most? Which customers ordered only once? What is the average order value per month?
Tip: save each query with a comment explaining the business question it answers.
Project 3: Data Cleaning and Exploration with Python
What you build: a Jupyter notebook that takes a messy dataset and turns it into an analysis-ready table, followed by basic exploration.
Data: a used-car listings or house-price dataset. These usually contain missing prices, mixed units and duplicate rows.
Steps: load the file with pandas, check missing values, fix data types, remove duplicates, handle outliers, then plot distributions and relationships with matplotlib.
Questions to answer: Which factor moves price the most? Are there listings that look like data-entry errors?
Tip: write a short markdown note before every code cell. Your notebook should read like a story, not a code dump.
Project 4: City Air Quality Dashboard in Power BI
What you build: an interactive dashboard that tracks air quality readings across Indian cities over time.
Data: air quality datasets published on data.gov.in or Kaggle.
Steps: import the file into Power BI, use Power Query to remove blanks, create a date table, then add a line chart for trends, a map for locations and slicers for city and year.
Questions to answer: Which months show the highest pollution? Do readings differ between industrial and residential monitoring stations?
Tip: colour should carry meaning. Use one colour scale for “good to poor” and keep it the same on every chart.

Project 5: Student Survey Analysis
What you build: your own survey, collected through Google Forms, analysed from start to finish.
Data: responses from 50 to 100 people. A simple idea: ask college students which skills they want to learn and how they prefer to study.
Steps: design 8 to 10 clear questions, collect responses, clean text answers, calculate percentages, compare groups using cross-tabs, and present results in charts.
Questions to answer: Do final-year students prefer different skills than first-year students? Which learning format is most popular?
Tip: collecting your own data is rare among beginners, so it stands out. Mention your sample size and its limits honestly.
Project 6: Employee Attrition Analysis (HR Analytics)
What you build: a report that explains why employees leave a company and which groups are most at risk.
Data: the IBM HR Analytics attrition dataset on Kaggle, a fictional dataset created for practice.
Steps: compare attrition by department, age band, overtime and salary band using Excel pivots or pandas, then visualise the biggest differences.
Questions to answer: Does overtime change the leaving rate? Do employees with long gaps since their last promotion leave more often?
Tip: report rates (for example, 20 percent of the group) rather than raw counts, because groups differ in size.
Project 7: Loan Default Analysis (Banking and Finance)
What you build: a short analysis showing which customer profiles are more likely to miss repayments.
Data: a public loan or credit dataset from Kaggle or the UCI repository.
Steps: clean income and employment fields, group borrowers by income band and loan amount, calculate default rates for each group, and chart the results.
Questions to answer: Which loan purposes show the highest default rate? Does a higher loan-to-income ratio increase risk?
Tip: state clearly that your findings describe the dataset and are not rules for real lending decisions.
Project 8: Hospital Appointment No-Show Analysis
What you build: an analysis of why patients miss scheduled appointments, with suggestions to reduce it.
Data: the public “Medical Appointment No Shows” dataset on Kaggle.
Steps: convert date fields, calculate the waiting time between booking and appointment, compare no-show rates by age group, day of the week and reminder status.
Questions to answer: Does a longer wait raise the no-show rate? Do reminders help?
Tip: healthcare data is sensitive. Only use anonymised public datasets and never upload real patient records.
Project 9: Local Business Sales and Seasonality Study
What you build: a sales analysis for a small local business, such as a garment shop, a sweet shop or a stationery store.
Data: ask a shop owner you know for permission to use their sales log with names and phone numbers removed, or build a realistic sample of 12 months of daily sales.
Steps: record the data in Excel, create a monthly trend, then mark festival periods. In Gujarat, Navratri and Diwali are major buying seasons, so a trend chart that highlights them tells a believable story.
Questions to answer: How much higher are festival-month sales? Which products sell best in each season? When should the shop stock up?
Tip: this is the project that makes a Vadodara interviewer smile, because it uses a business they recognise.
Project 10: Customer Segmentation Capstone (RFM Analysis)
What you build: an end-to-end project that groups customers by how recently they bought (Recency), how often (Frequency) and how much they spent (Monetary).
Data: an online retail transactions dataset from the UCI repository or Kaggle.
Steps: extract and aggregate the data with SQL, score each customer in Python, then present segments such as loyal customers, new customers and at-risk customers in a Power BI dashboard.
Questions to answer: Which segment brings the most revenue? Which customers should receive a win-back offer?
Tip: this capstone uses SQL, Python and Power BI together, so it shows you can move from raw tables to a decision.
Quick Comparison of All 10 Projects
Use this table to pick your starting point. Time estimates assume a few hours per week and are only a guide.
# | Project | Level | Main tools | Estimated time |
|---|---|---|---|---|
1 | Sales dashboard | Easy | Excel | 3 to 5 days |
2 | Customer orders with SQL | Easy | SQL | 4 to 6 days |
3 | Data cleaning and exploration | Easy to medium | Python | 1 week |
4 | Air quality dashboard | Medium | Power BI | 1 week |
5 | Student survey analysis | Easy | Google Forms, Excel | 1 week |
6 | Employee attrition | Medium | Excel or Python | 1 week |
7 | Loan default analysis | Medium | Excel or SQL | 1 week |
8 | Appointment no-shows | Medium | Python or Power BI | 1 to 2 weeks |
9 | Local business seasonality | Easy to medium | Excel, Power BI | 1 week |
10 | RFM customer segmentation | Advanced | SQL, Python, Power BI | 2 to 3 weeks |
If you are completely new, do projects 1, 2 and 5 first. They need the least setup and teach the habits every later project depends on.
How to Turn Your Projects into a Portfolio
Finishing a project is half the job. The other half is making it easy for a stranger to understand in two minutes.
- Create a free GitHub account and give every project its own folder.
- Write a short README for each one: the question, the data source, the tools, three key findings and one recommendation.
- Add visuals. Include dashboard screenshots or a link to a published report.
- Share the work. Put your best two or three projects on your LinkedIn profile under “Featured”.
- Prepare a 60-second story for each project: the problem, what you did, what you found, and what you would do next.
- Keep your files clean. Use clear file names, remove test files and make sure every notebook runs from top to bottom.
A useful rule: three well-explained projects beat ten half-finished ones.
Learning Data Analytics in Vadodara: What to Look For
Vadodara has many computer courses to choose from, so it helps to judge them by what you will actually do in class. Before you enrol anywhere, check these five things:
- Hands-on practice. Are you working on datasets from the first week, or only watching slides?
- A full tool stack. A good data analytics course in Vadodara should cover Excel, SQL, Python and Power BI in a logical order.
- Projects you can show. Ask how many projects you will complete and whether the trainer reviews them.
- Interview preparation. Portfolio reviews, mock interviews and resume help matter as much as the tools.
- Convenient location and timing. Regular attendance is what makes a course work, so pick a centre you can reach easily.
Bright Computer Education teaches data analytics with this practical approach, with training centres in Sayajiganj, Manjalpur and Waghodia Road in Vadodara, plus a centre in Anand. If you want a structured path, you can explore the institute’s Data Analytics Course in Vadodara, the Data Analyst Training in Vadodara programme, or tool-specific courses such as Power BI, Python and Advanced Excel.
Whichever institute you choose, visit the centre, speak to the trainer and ask to see sample student work. A short conversation will tell you more than any brochure.
Common Beginner Mistakes (and How to Avoid Them)
Mistake | Why it hurts | What to do instead |
|---|---|---|
Using only famous “toy” datasets | Every other candidate shows the same work | Add one project built on your own or local data |
Skipping data cleaning | Wrong inputs give wrong answers | Always check missing values and duplicates first |
Showing charts without a conclusion | The reader cannot tell what matters | Write the finding in one sentence under each chart |
Overloading dashboards | Too many visuals hide the message | Keep to 4 to 6 visuals with one clear purpose |
Copying a tutorial exactly | You cannot explain choices in an interview | Change the question or dataset and explain why |
Ignoring the limits of the data | Overconfident claims damage trust | State sample size, time period and what is missing |
Frequently Asked Questions (FAQs)
What are the best data analytics projects for beginners?
The best data analytics projects for beginners include sales analysis, customer segmentation, student performance analysis, HR analytics, and e-commerce sales analysis. These projects help develop practical data analysis skills.
Which tools are needed for data analytics projects?
Beginners can use Microsoft Excel, SQL, Python, Power BI, and Tableau to analyze data, create visualizations, and generate meaningful insights.
Can I learn data analytics through projects?
Yes, working on practical projects helps you understand data cleaning, analysis, visualization, and reporting while improving your problem-solving skills.
How can beginners get datasets for data analytics projects?
Beginners can download free datasets from Kaggle, Google Dataset Search, and government open-data portals to practice data analysis.
What is the easiest data analytics project for beginners?
Sales data analysis using Microsoft Excel is one of the easiest projects. It helps beginners learn data cleaning, formulas, pivot tables, charts, and basic reporting.
Are data analytics projects important for getting a job?
Yes, practical projects demonstrate your analytical skills and help employers understand your ability to solve real-world business problems.
How many projects should a beginner include in a data analytics portfolio?
Beginners should aim for 3–5 quality projects that demonstrate different skills, such as data cleaning, SQL queries, dashboard creation, and data visualization.
Can I create data analytics projects without coding?
Yes, you can start with Microsoft Excel and Power BI without extensive coding knowledge. Later, you can learn SQL and Python to analyze more complex datasets.
Conclusion: Start Small, Finish One Project This Week
You do not need a perfect plan to begin. Pick one idea from this list, spend a week on it, and publish the result with a clear write-up. Then do the next one. After three or four projects, you will have a portfolio, real stories for interviews and far more confidence with data than any amount of passive reading can give you.
If you prefer to learn with a trainer and a structured path, visit a centre of Bright Computer Education in Vadodara, talk to the counsellors about the data analytics syllabus, and ask which of these projects fit into the course. A project started under guidance is often finished faster.