

Data Analytics Without Coding: 5 Important Things Beginners Should Know
Many beginners believe that data analytics starts with Python, R or complicated database queries. That belief stops a lot of capable students from even trying. The reality is simpler: data analytics without coding is a genuine, practical starting point, and plenty of working analysts still spend most of their day in spreadsheets and dashboard tools rather than in a code editor.
If you are a college student in Vadodara, a working professional thinking about a career change, or a shop owner who wants to understand your own sales numbers, this guide is written for you. Below, we explain what no-code analytics really means, the five things every beginner should know before starting, a step-by-step roadmap you can follow, and how to choose the right path among the many computer courses in Vadodara.
What Does "Data Analytics Without Coding" Really Mean?
Data analytics is the process of collecting data, cleaning it, finding patterns and turning those patterns into decisions. Writing code is one way to do these steps. It is not the only way. In no-code analytics you do the same work through formulas, menus, drag-and-drop fields and visual dashboards.
Take a simple example. A garment shop owner has a monthly sales file with 5,000 rows: date, product, area, quantity and amount. Without writing a single line of code, she can remove duplicate rows with one button, build a pivot table to see sales by product, draw a chart of the monthly trend, and put everything on one dashboard. That is real analytics, and it leads to real decisions, such as which product to stock more of before the festival season.
It also helps to be clear about what no-code does not mean:
- It does not mean no thinking. You still need to ask good questions and judge whether an answer makes sense.
- It does not mean no logic. Excel formulas such as IF, SUMIFS and XLOOKUP are a light form of logic. If you can write them, you are already thinking like an analyst.
- It does not mean forever. Many analysts begin with no-code tools and add SQL or Python later, when their work needs it.
Think of no-code analytics as the front door to the field. You can walk in today, and you can explore the rest of the building as you grow.
1. You Can Start with Tools You Already Know
The best first tool for data analytics without coding is probably already on your computer: Microsoft Excel or Google Sheets. Both can handle the full beginner workflow, from raw data to a finished chart.
Do not rush past them to the “advanced” tools. A person who is truly comfortable with these spreadsheet features will find every other tool easier to learn:
Analytics task | Spreadsheet feature to learn | Example use |
|---|---|---|
Organising data | Sort, filter, tables | Show only orders from one city |
Looking up values | XLOOKUP or VLOOKUP | Pull a product price from a price list |
Conditional totals | SUMIFS, COUNTIFS, AVERAGEIFS | Total sales for one product in one month |
Summarising quickly | Pivot tables | Sales by area and by month in two minutes |
Spotting patterns | Conditional formatting, charts | Highlight stores below target |
Cleaning messy data | Remove duplicates, Text to Columns, Power Query | Split “Name, City” into two columns |
A small note on versions: XLOOKUP is available in Excel 2021 and Microsoft 365, but not in older versions such as Excel 2016. If your computer has an older version, learn VLOOKUP first and move to XLOOKUP when you upgrade.
Practice tip: Download any small dataset, for example a list of 200 to 500 orders, and answer five questions using only pivot tables. Which product sold the most? Which month was weakest? Which area gave the highest average order value? Writing the question first and then finding the answer is the habit that turns a spreadsheet user into an analyst.
2. Powerful No-Code Tools Exist Beyond the Spreadsheet
Once you are comfortable with spreadsheets, the next step is a dedicated business intelligence (BI) tool. These tools connect to your data, let you build charts by dragging fields onto a canvas, and combine many charts into an interactive dashboard that a manager can click through.
Here is how the most common options compare for a beginner:
Tool | Best for | Cost to start | Things to know |
|---|---|---|---|
Microsoft Excel | Cleaning, pivot tables, quick charts | Paid desktop app; Excel for the web is free with a Microsoft account | The foundation for every other tool |
Google Sheets | Shared work and simple reports | Free with a Google account | Easy to collaborate, less powerful on big files |
Power BI Desktop | Professional dashboards and reports | Desktop app is free to download (Windows only) | Sharing reports with others usually needs a paid licence |
Tableau Public | Visual storytelling and portfolios | Free | Anything you publish is public, so never upload private data |
Looker Studio | Web reports connected to Google Sheets | Free | Good for simple, shareable marketing and sales reports |
Prices and licence rules change from time to time, so check each company’s official page before you decide.
Which one should you choose? For most learners in India, Excel followed by Power BI is a sensible pair. Excel is used in almost every office, and Power BI is widely asked for in analyst job descriptions. Tableau Public is a great extra for building a visible portfolio, and Looker Studio is useful if your data already lives in Google Sheets.
A good rule: learn one BI tool properly before touching a second. Ten hours of focused practice in a single tool teaches more than a month of switching between four.
3. Thinking Skills Matter More Than Tools
Tools change every few years. The thinking behind good analysis does not. Three skills decide whether your dashboards are useful or just decorative.
Ask a clear question first
“Analyse our sales” is not a question. “Which three products brought the most profit in the last six months, and did that change after we raised prices?” is. Before you open any tool, write down the decision your analysis should support. If nobody will act on the answer, the analysis is probably not worth doing.
Clean the data before you trust it
Real data is messy. Analysts often spend more time cleaning data than charting it. Before analysing any file, run through this short checklist:
- Remove exact duplicate rows.
- Check for blank cells in important columns and decide whether to fill, ignore or remove them.
- Make spellings consistent, for example “Vadodara”, “Baroda” and “vadodara” should be one value.
- Confirm that dates are stored as real dates, and numbers as real numbers, not text.
- Look for impossible values, such as a negative quantity or an order dated in the future.
Learn a few basic statistics
You do not need advanced mathematics. You do need to understand a handful of ideas well:
- Average (mean) versus median. Suppose five employees earn ₹20,000, ₹22,000, ₹24,000, ₹25,000 and ₹2,00,000. The mean is ₹58,200, which describes nobody in the group. The median is ₹24,000, which is much closer to the typical person. Knowing which one to report is an analyst’s skill.
- Percentage change. Sales rising from ₹80,000 to ₹92,000 is a 15% increase, calculated as (92,000 − 80,000) ÷ 80,000.
- Correlation is not causation. If ice cream sales and sunburn cases rise together, the weather explains both. One does not cause the other.
These ideas apply in every tool, with or without code.
4. Know the Limits of No-Code, and When to Add SQL or Python
Being honest about limits will save you time and disappointment. No-code analytics is excellent for learning, for small and medium datasets, and for many everyday business reports. It starts to struggle in a few situations:
| Situation | No-code is enough when… | Consider SQL or Python when… |
|---|---|---|
Data size | The file opens comfortably in Excel (a worksheet holds up to 1,048,576 rows) | Data is far bigger, or too slow to open |
Data source | You work from files someone sends you | Your company stores data in a database and you must pull it yourself |
Repetition | You build a report once or twice | You rebuild the same report every week and want to automate it |
Analysis depth | You need summaries, trends and charts | You need forecasting, statistical modelling or machine learning |
The practical lesson is that SQL is usually the first thing to add. It is a query language for asking questions of databases, and its basic commands read almost like English. Many analyst job descriptions mention SQL, so even a no-code beginner benefits from learning it within the first year. Python is a useful second step, but it is rarely the first requirement for an entry-level role.
A sensible order for most beginners looks like this:
- Excel or Google Sheets
- One BI tool, such as Power BI
- Basic statistics
- SQL
- Python, when your work or goals call for it
Notice that you begin with results, not syntax. That keeps motivation high, and every new skill then solves a problem you have already met.
5. Real Projects Matter More Than Certificates
A certificate shows that you attended. A project shows that you can do the work. When a hiring manager looks at a fresher’s profile, a small, well-explained project often says more than a long list of course names.
You do not need a company to give you data. Here are project ideas that suit beginners:
- Sales analysis: Use a public retail dataset, or a friendly shop’s records with permission, to find top products, weak months and best customer areas.
- Personal expense tracker: Record your own spending for a month, categorise it, and build a dashboard showing where the money goes.
- Student attendance or marks analysis: Use anonymised data, never real names, to find patterns across subjects or months.
- Public data study: India’s Open Government Data platform (data.gov.in) and Kaggle both offer free datasets on topics such as population, agriculture and transport.
- Cricket or sports statistics: Compare batting averages, strike rates or team results. Sports data keeps you curious, which is half the battle.
How to present a project
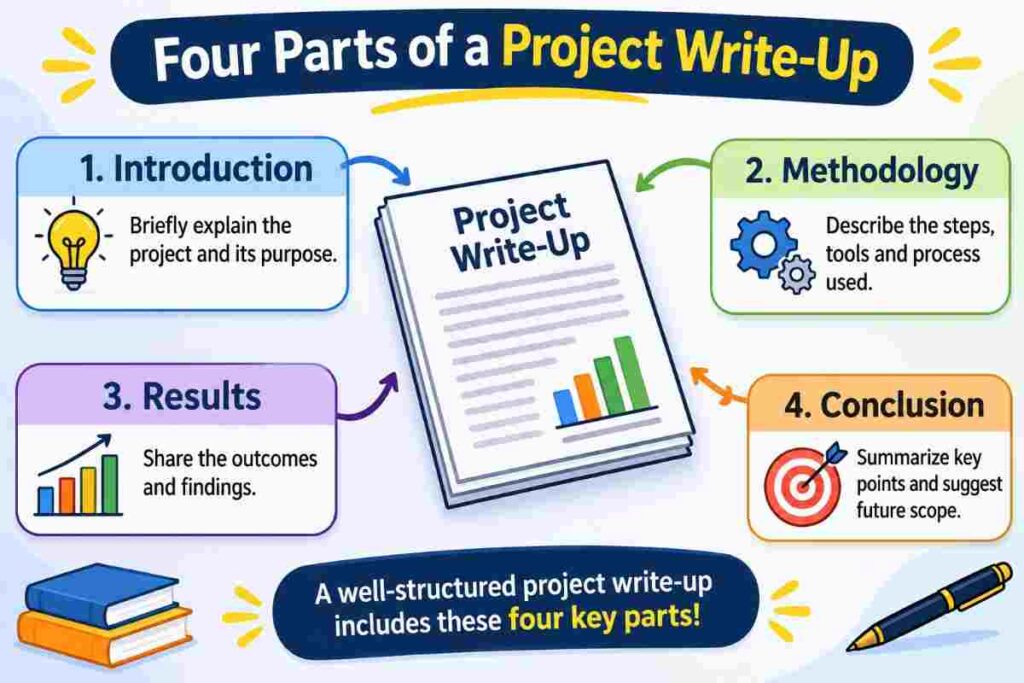
For every project, write a short note in four parts, so that a reader can understand it in two minutes:
- The problem: What question were you trying to answer?
- The data: Where did it come from, and how big was it?
- The steps: What cleaning and analysis did you do?
- The insight: What did you find, and what would you recommend?
Publish your dashboard on Tableau Public or share screenshots in a simple document, and add the link to your resume and LinkedIn profile. Three solid projects are far better than ten half-finished ones.
A Simple Step-by-Step Roadmap for Beginners
If you can give one hour a day, this plan takes you from zero to a first portfolio in roughly three to four months. Adjust the pace to your own schedule.
- Weeks 1 to 3: Spreadsheet basics. Learn formulas, sorting, filtering, lookups and pivot tables. Finish by building a small sales summary.
- Weeks 4 to 5: Data cleaning. Practise the cleaning checklist from Section 3 on two or three messy files.
- Weeks 6 to 7: Statistics in plain language. Learn mean, median, percentages, spread and correlation using real examples.
- Weeks 8 to 11: One BI tool. Learn Power BI or Tableau Public: connecting data, building charts, filters and a one-page dashboard.
- Weeks 12 to 14: SQL basics. Learn SELECT, WHERE, GROUP BY and JOIN, and repeat your earlier questions in SQL.
- Weeks 14 to 16: Portfolio and interview practice. Complete two or three projects, write them up, and practise explaining your charts aloud.
A quick worked example
Imagine a stationery wholesaler with 3,000 orders. Here is how a beginner would handle it without code:
- Question: Which areas bring the most revenue, and is any area declining?
- Clean: Remove duplicates, fix area spellings, convert text dates into real dates.
- Summarise: Build a pivot table with area in rows, month in columns and revenue as values.
- Visualise: Add a line chart for monthly trend and a bar chart for revenue by area.
- Conclude: Write two sentences, for example: “Revenue from Area B fell for three months in a row. We should check whether a competitor opened nearby or a key customer stopped ordering.”
The last step is the one beginners skip. A chart without a conclusion is just a picture. The conclusion is what makes it analytics.
Learning Data Analytics in Vadodara: What to Look For
Vadodara is a good city to start in. It has a strong industrial base in chemicals, petrochemicals, pharmaceuticals and engineering, a large student population around institutions such as The Maharaja Sayajirao University of Baroda, and a growing services and IT sector. Every one of these businesses produces data on sales, stock, production, staff and finance, and someone has to make sense of it. That is why basic analytics skills are useful for commerce graduates, engineers, accountants and small business owners alike, not only for people with an IT degree.
If you decide to learn with guidance, a classroom or a mentor can shorten the path considerably. With so many computer courses in Vadodara to choose from, use this checklist to compare them:
- Does the syllabus start from the basics? A good Data Analytics Course in Vadodara should begin with Excel and move step by step to SQL, statistics and a BI tool.
- Is the training practical? You should be working on real datasets in almost every session, not only watching slides.
- Will you build projects? Ask to see sample projects from earlier batches.
- Is there interview and portfolio support? Mock interviews and help with presenting your work matter for freshers.
- Can you attend a demo class? A trial session shows you the teaching style before you pay.
- Are the promises realistic? Be careful with anyone who guarantees a job. Skills and effort get you hired, not a brochure.
At Bright Computer Education, the Data Analyst Training in Vadodara programme follows this practical approach. It covers Excel, SQL, statistics, Python, data cleaning and exploratory analysis, Power BI, data visualisation, real-world projects, and interview and portfolio preparation, so that learners can begin with no-code tools and grow into SQL and Python at their own pace. You can read the full course outline on the Data Analyst Training in Vadodara page.
Frequently Asked Questions (FAQs)
Can I become a data analyst without coding?
You can begin and do useful analytical work without coding, and some entry-level roles rely mainly on Excel and a BI tool. For long-term growth, though, learning SQL is strongly recommended, because many employers expect it.
Which tool should a complete beginner learn first?
Start with Excel or Google Sheets. Once you can build pivot tables and clean a messy file, move on to Power BI or Tableau Public.
Is Power BI free to learn?
Power BI Desktop can be downloaded free of charge and is enough for learning and building reports on your own computer. Sharing reports with other people in an organisation usually requires paid licensing, so check Microsoft’s current terms.
How long does it take to learn data analytics without coding?
With about an hour of daily practice, most beginners can learn the basics of spreadsheets, statistics and one BI tool in three to four months. Building confidence through projects takes longer, and that is normal.
Do I need to be good at mathematics?
No. School-level mathematics, percentages and averages cover most of what a beginner needs. Clear thinking matters more than complex formulas.
Can a fresher get a data analyst job?
Yes. Freshers are hired every year, especially those who show a portfolio of real projects and good communication skills. Internships and entry-level reporting roles are a common starting point.
How do I choose between different computer courses in Vadodara?
Compare the syllabus, trainer experience, project work, batch size and placement or career guidance. Attend a demo class before paying any fees.
Can I learn data analytics while studying or working?
Yes. Weekend and evening batches, as well as online resources, make it possible to learn alongside college or a job. Consistency matters more than speed.
Do I need a computer science or IT degree?
No. People from commerce, science, engineering and arts backgrounds all move into analytics. A strong portfolio and good communication count for a lot.
Final Thoughts
Data analytics without coding is not a shortcut or a lesser path. It is a sensible way to learn the real skills of the profession first: asking good questions, cleaning data, understanding basic statistics and telling a clear story with numbers. Start with a spreadsheet, add one BI tool, practise on real projects, and bring in SQL and Python when your goals need them.
If you would like structured guidance, Bright Computer Education offers practical data analytics training in Vadodara for beginners, freshers and working professionals. Visit brightcomputeredu.com to explore the courses, or pick a small dataset today and answer your first question. The best time to begin is when the data is in front of you.