

10 Real-World Data Analytics Projects to Boost Your Resume
Ask any hiring manager what they look for in a junior analyst’s resume, and you will hear a similar answer: show me what you have actually done. A list of tools and a course certificate tells them what you studied. A well-chosen project tells them what you can do.
That is why data analytics projects have become the most valuable section of a fresher’s resume. They prove that you can take a vague business question, find the right data, clean it, analyse it and explain the result in plain language. They also give you something concrete to talk about in interviews, which is where many candidates struggle.
This article gives you ten practical project ideas, explains how to approach each one, and shows how to describe them on your resume. Whether you are a student in Vadodara finishing your degree, a graduate looking for your first job, or a working professional planning a switch into analytics, you can start with any of these projects using free tools and public data.
What Makes a Project "Resume-Worthy"?
Not every project helps your resume. Hiring managers have seen hundreds of identical tutorial projects, so yours needs to stand apart. A strong project usually has these qualities:
- A clear business question. “Which customers are likely to stop buying?” is stronger than “Analysis of a customer dataset.”
- Messy, realistic data. Real data has missing values, duplicates and inconsistent formats. Showing how you handled them is part of the value.
- Your own thinking. Even if the dataset is public, your questions, decisions and conclusions should be your own.
- A recommendation. The best projects end with advice a business could act on.
- Clear presentation. A tidy dashboard or a short written summary makes your work easy to understand.
Keep this checklist nearby while you read the ideas below.
Where to Find Data for Your Projects
You do not need company data to build good projects. These sources are free and widely used:
- The Open Government Data Platform India for datasets on agriculture, health, education, transport and more
- Kaggle datasets covering sales, finance, healthcare, sports and many other areas
- Sample or anonymised records from a small business, a college club or an NGO, with permission
- Data you collect yourself, such as a survey of fellow students
Always read the licence or terms of use before using a dataset in a public portfolio.
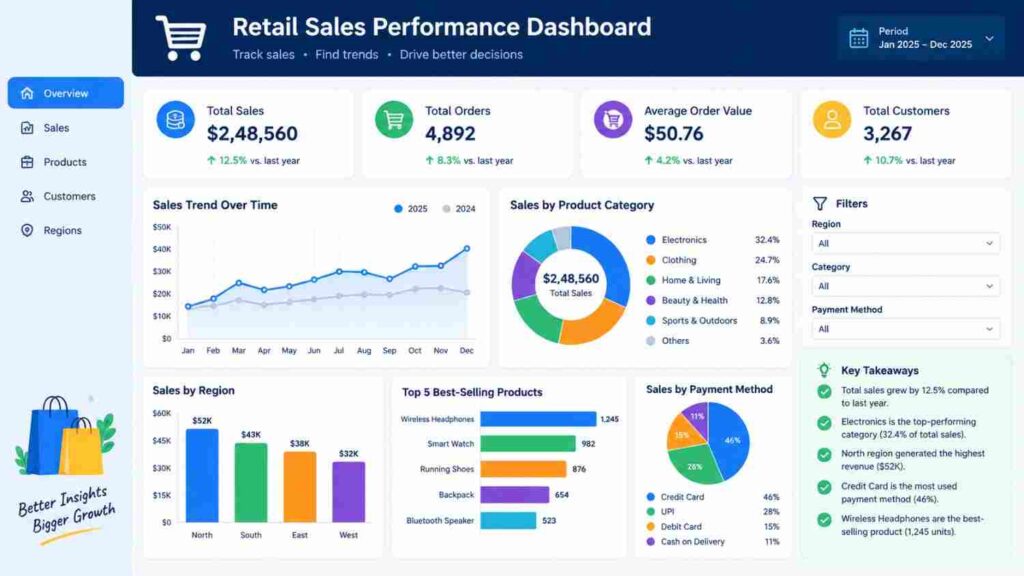
Project 1: Retail Sales Performance Dashboard
Business question: Which products, regions and months drive the most revenue and profit, and where are we losing money?
Tools: Excel, Power BI
How to approach it:
- Import the sales data and check for duplicates and blank cells.
- Create calculated columns such as profit margin and discount percentage.
- Build a dashboard with monthly sales, top ten products, regional comparison and returns.
- Add filters so a manager can explore the data without your help.
What to highlight: One insight that changes a decision, for example, a popular product that earns very little profit because of heavy discounts.
This is the ideal first project because it covers the full workflow in a form that every employer understands.
Project 2: Customer Churn Analysis
Business question: Which customers are most likely to leave, and what do they have in common?
Tools: SQL, Python (Pandas, Matplotlib)
How to approach it:
- Use a telecom or subscription dataset that includes a “churned” column.
- Compare churn rates by contract type, tenure, monthly charges and support calls.
- Visualise the patterns using bar charts and simple correlation tables.
- Suggest two or three retention actions based on your findings.
What to highlight: A statement such as “Customers in their first six months on monthly plans showed the highest churn,” followed by a practical recommendation.
Project 3: HR Attrition and Employee Satisfaction Study
Business question: Why are employees leaving, and which departments are most affected?
Tools: Excel, Python or Power BI
How to approach it:
- Clean the HR dataset and group employees by department, age band, salary band and years of service.
- Calculate attrition rates for each group.
- Examine factors such as overtime, job satisfaction and promotion history.
- Present the findings as a short report for an HR manager.
What to highlight: Your ability to work with people-related data responsibly, and to turn numbers into practical suggestions rather than blame.
Project 4: Inventory and Stock-Out Analysis
Business question: Which items are overstocked, which run out too often, and how can stock levels be improved?
Tools: Excel, SQL, Power BI
How to approach it:
- Use an inventory or supply chain dataset with stock levels, sales and reorder dates.
- Calculate stock turnover and days of inventory for each item.
- Classify items into fast-moving, slow-moving and dead stock.
- Flag items that frequently run out and estimate the sales lost.
Why it matters locally: Vadodara and the surrounding region have a strong base in manufacturing, engineering, chemicals and pharma, where inventory and supply chain efficiency are daily concerns. A project in this area signals that you understand the kind of problems local employers face.
Project 5: Marketing Campaign Performance Analysis
Business question: Which marketing channels bring the best return on spend?
Tools: Excel, Power BI, basic statistics
How to approach it:
- Use campaign data covering channels such as email, social media and search ads.
- Calculate click-through rate, conversion rate, cost per lead and return on investment.
- Compare channels and campaign periods.
- Recommend where the budget should increase or decrease.
What to highlight: Business thinking. Marketing teams care about results, so frame your findings in terms of cost and return, not just clicks.
Project 6: Student Enrollment and Course Demand Study
Business question: Which courses attract the most students, and how does demand change across the year?
Tools: Excel, Power BI
How to approach it:
- Create or collect a dataset of enquiries, enrolments and completions across courses, for example from a college department or a small survey.
- Analyse enrolment by month, course category and enquiry source.
- Calculate the conversion rate from enquiry to admission.
- Suggest the best months for promotion and which courses need more outreach.
Why it works: It shows you can apply analytics beyond typical corporate examples, and it relates directly to the education sector, where many learners in Vadodara begin their careers.
Project 7: Customer Segmentation Using RFM Analysis
Business question: Who are our best customers, and how should we treat different groups differently?
Tools: SQL, Python or Excel
How to approach it:
- Use an e-commerce or retail transaction dataset.
- For each customer, calculate Recency (days since last purchase), Frequency (number of purchases) and Monetary value (total spend).
- Score each measure and combine the scores to group customers into segments such as champions, loyal customers, at-risk customers and lost customers.
- Suggest a different action for each segment, such as a loyalty offer or a win-back message.
What to highlight: This project demonstrates a respected, practical technique that many businesses actually use.
Project 8: Loan Default and Credit Risk Analysis
Business question: What characteristics are linked to loan defaults?
Tools: SQL, Python, statistics
How to approach it:
- Use a loan dataset with applicant details, income, loan amount and repayment status.
- Explore default rates across income groups, loan purposes and credit history.
- Create simple risk bands and show how default rates differ between them.
- Summarise which factors a lender should watch most closely.
What to highlight: Careful reasoning. Finance employers appreciate analysts who state assumptions and limits clearly, so mention what your data cannot tell you.
Project 9: Hospital Appointment and No-Show Analysis
Business question: Why do patients miss appointments, and how could a clinic reduce no-shows?
Tools: Excel, Python, Power BI
How to approach it:
- Use a public appointment dataset that includes booking date, appointment date, age group and attendance status.
- Calculate no-show rates by waiting time, day of the week and age group.
- Look for patterns, such as longer waiting times leading to more missed visits.
- Recommend practical steps, like reminder messages or flexible rescheduling.
What to highlight: Healthcare is a growing area for analytics, and this project shows you can handle sensitive, real-world data with care. Always use anonymised data only.
Project 10: Sales Forecasting for the Next Quarter
Business question: What sales should a business expect over the next three months?
Tools: Excel, Python
How to approach it:
- Use at least two years of monthly sales data.
- Plot the trend and look for seasonality, such as festive-season peaks.
- Build a simple forecast using moving averages or Excel’s forecasting feature, then compare it with a basic Python model if you are comfortable.
- State how much error you expect and what could change the forecast.
What to highlight: Honesty about uncertainty. A forecast presented with a clear range and stated assumptions looks far more professional than a single confident number.
Quick Comparison of the 10 Projects
| # | Project | Main tools | Level | Best for showing |
|---|---|---|---|---|
| 1 | Retail sales dashboard | Excel, Power BI | Beginner | End-to-end workflow |
| 2 | Customer churn analysis | SQL, Python | Intermediate | Pattern finding |
| 3 | HR attrition study | Excel, Power BI | Beginner | People analytics |
| 4 | Inventory analysis | Excel, SQL | Intermediate | Operations thinking |
| 5 | Marketing campaign analysis | Excel, Power BI | Beginner | Business ROI focus |
| 6 | Enrollment and course demand | Excel, Power BI | Beginner | Education sector use |
| 7 | RFM segmentation | SQL, Python | Intermediate | Practical technique |
| 8 | Loan default analysis | SQL, Python | Advanced | Risk reasoning |
| 9 | Appointment no-show study | Python, Power BI | Intermediate | Healthcare analytics |
| 10 | Sales forecasting | Excel, Python | Advanced | Forecasting basics |
A sensible plan for a beginner is to complete one project from each level, so your portfolio shows growth rather than repetition.
How to Present Your Projects on Your Resume
Writing the project well matters as much as doing it. Use this simple formula for each one: action + data + tool + result.
Weak example: “Made a dashboard for sales data.”
Strong example: “Built a Power BI dashboard from 24 months of retail sales data, identified three high-discount products with below-average margins, and recommended a revised pricing approach.”
Keep each project to two or three lines. Add a link to your portfolio or GitHub page so a recruiter can see the full work in one click.
How to Build a Simple Portfolio Page for Each Project
For every project, write a short page with five parts:
- The problem: What were you trying to find out, and why does it matter?
- The data: Where did it come from, and what did you clean?
- The method: Which tools and steps did you use?
- The findings: Two or three clear charts with short explanations.
- The recommendation: What should the business do next?
Write in simple language, as if explaining to a manager with two minutes to spare. If a non-technical person can follow your page, it is working.
Common Mistakes to Avoid
- Copying tutorial projects exactly. Change the dataset or ask a new question, so the work is genuinely yours.
- Skipping data cleaning. Real analysts spend a large share of their time on it, and interviewers will ask about it.
- Showing charts without insight. Every chart should answer a question or support a decision.
- Using too many tools. A project built carefully in Excel and SQL is better than a messy one using six tools.
- Not being able to explain your work. If you cannot walk an interviewer through your project in two minutes, practise until you can.
How to Talk About Your Projects in Interviews
Interviewers often begin with, “Tell me about a project you are proud of.” Prepare a short answer using this structure:
- Situation: The business question you chose.
- Action: What you did, in two or three steps.
- Result: What you found and what you would recommend.
- Reflection: What you would improve with more time or data.
Being open about limitations, such as small data or missing fields, shows maturity and often leaves a better impression than pretending the project was perfect.
Learning With Guidance in Vadodara
Building projects alone is possible, but many learners progress faster when a trainer reviews their work and points out gaps. If you are looking for structured computer courses in Vadodara, Bright Computer Education offers a data analytics course in Vadodara that combines Excel, SQL, Python and Power BI with hands-on projects and interview preparation. Whichever institute you choose, look for real project work, regular feedback and help with building your portfolio, because these are the things that translate into interview calls.
Frequently Asked Questions (FAQs)
How many data analytics projects should I include on my resume?
Two to four strong projects are enough for a fresher. Choose ones that show different skills, such as a dashboard, a SQL analysis and a Python project.
Can I use public datasets for my projects?
Yes. Public datasets are widely used in portfolios. What matters is that you ask your own questions, document your work and offer your own conclusions.
Do I need Python for these projects?
Not for all of them. Several can be completed with Excel, SQL and Power BI. Python becomes useful for projects involving larger datasets, statistics or forecasting.
Where should I publish my projects?
A GitHub profile, a public Power BI report or a simple portfolio page all work. Include the link on your resume and LinkedIn profile.
How long does one project take?
A beginner project may take one to two weeks of regular practice, and an advanced one may take longer. Spend time on cleaning and explanation, not only on charts.
Are projects more important than certificates?
Certificates show that you completed training, while projects show that you can apply it. Employers generally value both, but projects are what start the best interview conversations.
Can I use my own work or college data?
Yes, with permission and with personal details removed. Real data from a college club, a family business or a local organisation can make your project more original.
What if my project looks similar to others online?
Add something that makes it yours: a different dataset, an extra question, a local angle or a deeper recommendation. Even a small original twist changes how the project is seen.
Final Thoughts
A resume that says “learned data analytics” is easy to ignore. A resume that says “built a customer segmentation model that grouped 10,000 customers into five actionable segments” is hard to ignore. The difference is projects.
Pick one idea from this list and start this week. Download a dataset, write down your business question, and keep notes as you work. Within a couple of months, you can have a small portfolio that speaks for you long before you walk into the interview room.
Want guided support while you build your portfolio? Get in touch with the team at Bright Computer Education in Vadodara to learn about batches, syllabus and project-based training.