
Turning 500,000 card transactions into one clear performance story
A payment card business can post big numbers and still leave managers guessing. CardMaster recorded 500,000 transactions from 100,000 customers over five years. Harsh Vasava turned that data into one dashboard that answers where the revenue comes from and how healthy the business really is.
Harsh Vasava
Power BI Desktop
The Business Problem
CardMaster issues 20 Mastercard payment products to customers in many countries. Management needed clear answers to a few simple questions. Which countries, channels and products drive revenue? Who are the most valuable customers? Is the business growing, and is that growth profitable?
The raw data could not answer these on its own. It needed to be cleaned, summarised and presented so that anyone could read the story in minutes.
Project Snapshot
Student Harsh Vasava
Course Data Analytics
Batch 2025
Tool Power BI Desktop
Project CardMaster Annual Performance Analysis
What Harsh Built
Six connected Power BI dashboards, plus a conclusions page, covering the period from 2021 to 2025.
- Executive Analysis
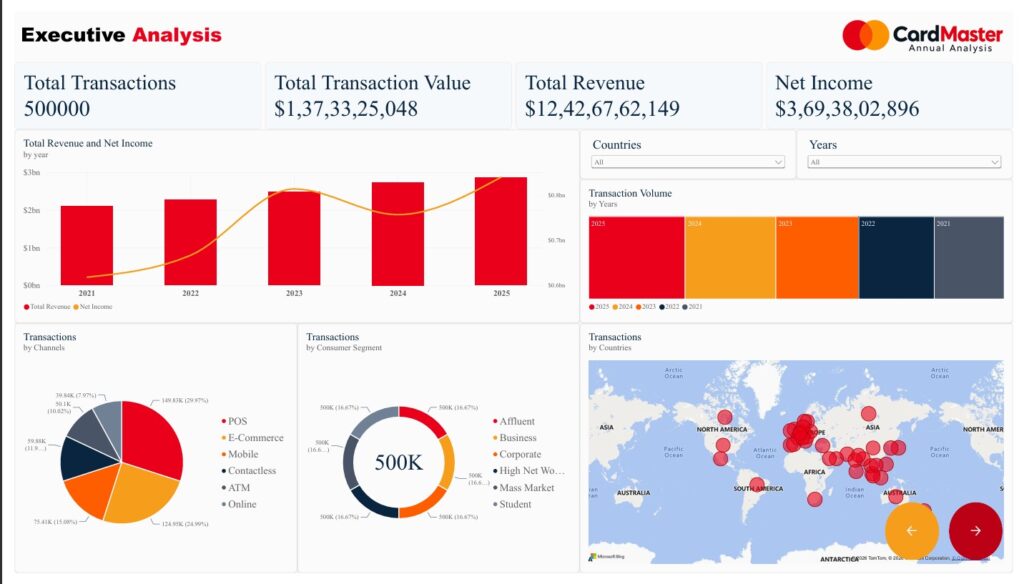
Headline KPIs, revenue and net income by year, transactions by channel and by consumer segment.
- Global Presence
Transactions, net income and growth by country, plus the top 10 currencies by transaction value.
- Consumer Intelligence
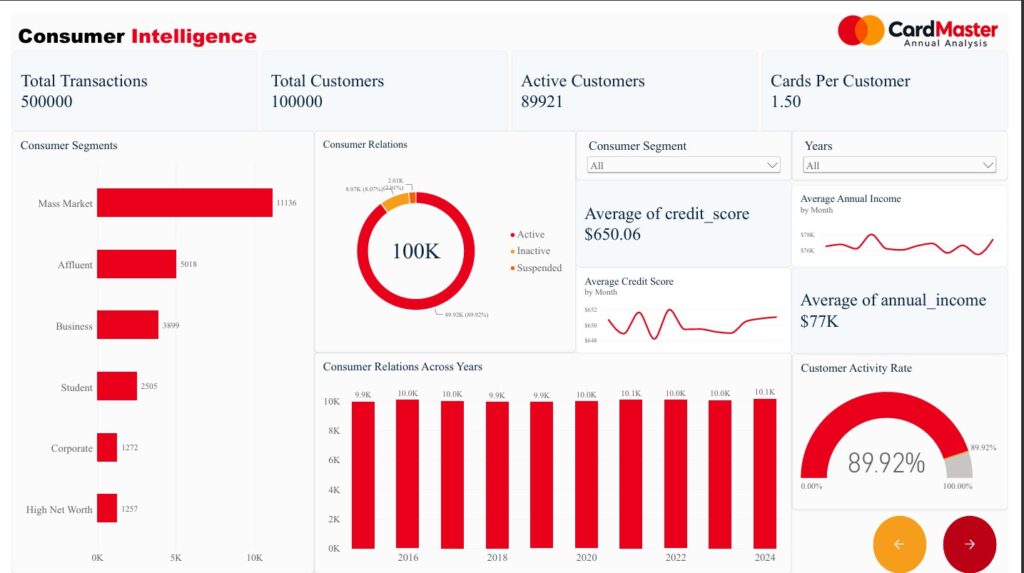
Customer segments, active and inactive status, credit score and annual income.
- Products Analysis
20 payment products by transactions, value, annual fee and interchange rate.
- Date & Time Intelligence
Growth trends with year, quarter and date filters, and a monthly transaction table.
- Financial Analysis
Revenue, net income, operating expenses, margins and segment comparisons.
Key findings
Customers stay active. 89,921 of 100,000 customers are active.
That is an activity rate of 89.92%. About 8% of customers are inactive and about 2% are suspended. Each customer holds 1.5 cards on average, with an average credit score of 650 and an average annual income of about $77K.
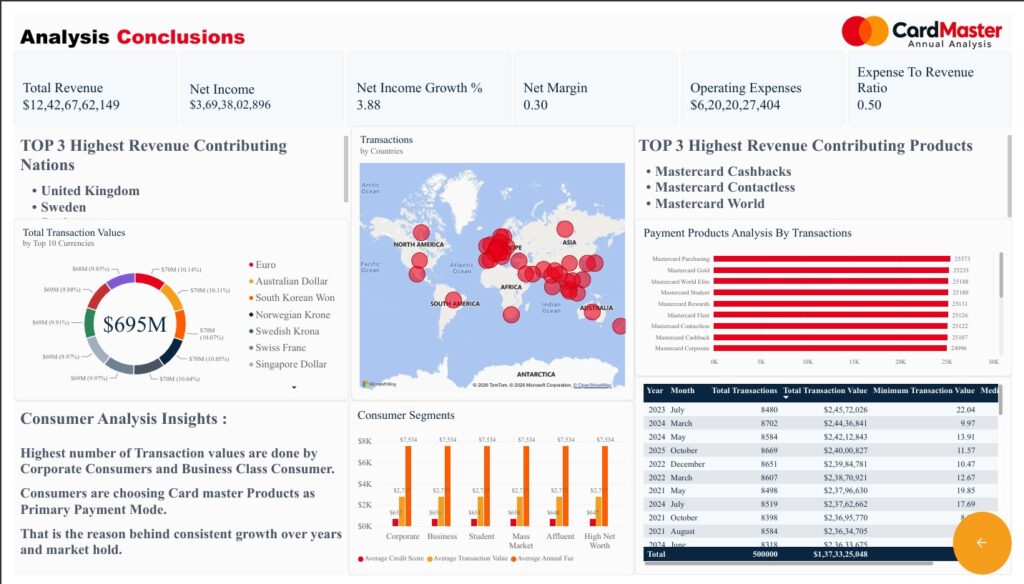
Profitability is solid. Net income is about $3.69B on revenue of about $12.43B.
That gives a net margin of 0.30. Operating expenses are about $6.2B, so the expense-to-revenue ratio is 0.50. Net income growth is 3.88%.
Two channels carry the volume. POS and E-Commerce lead.
POS handles 149.83K transactions (29.97%) and E-Commerce 124.95K (24.99%). Mobile follows with 75.41K (15.08%). Together, POS and E-Commerce account for more than half of all activity.
Three countries lead on revenue. The United Kingdom, Sweden and Spain.
The United Kingdom also has the highest transaction count, at 13,117. Sweden and the United Kingdom stand out on the financial page, with revenue of about $59.1M and $56.0M. Growth is strong in smaller markets too, such as Ireland (8.31%) and Indonesia (8.66%).
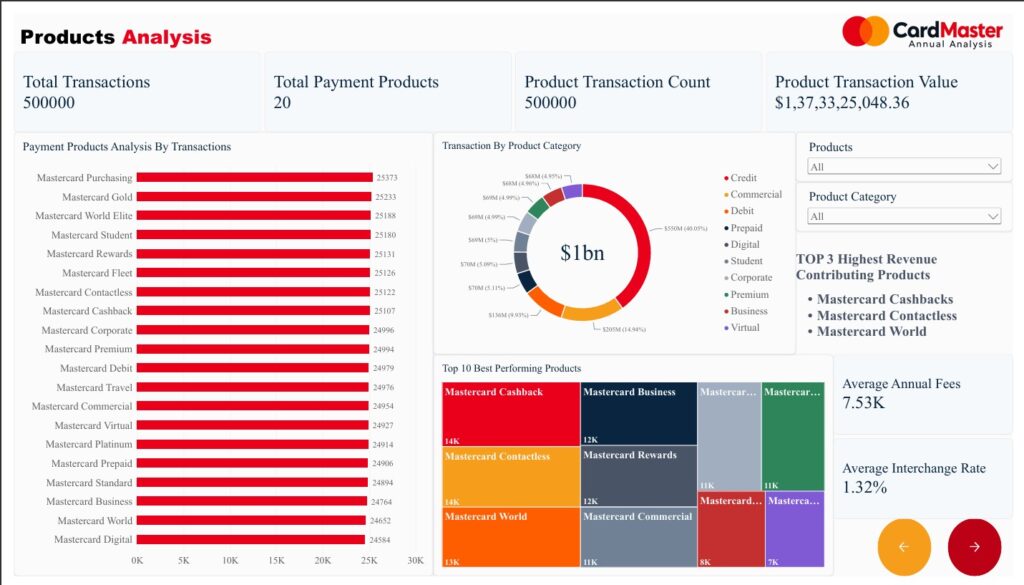
Cashbacks, Contactless and World earn the most. Purchasing is used the most.
Mastercard Cashbacks, Contactless and World are the top three products by revenue. By transaction count, Mastercard Purchasing leads with 25,373, ahead of Gold (25,233) and World Elite (25,188). Credit is the largest category at about $550M (40.05%), followed by Debit at about $205M (14.94%).
Corporate and Business customers spend the most.
The dashboard links the highest transaction values to these two segments. The segment view compares average credit score, average transaction value and average annual fee for Corporate, Business, Student, Mass Market, Affluent and High Net Worth customers.
Growth cooled in 2025. Transaction value growth fell to about -2%.
The trend rose above zero in 2023, eased in 2024 and dipped in 2025. Purchases are the dominant transaction type, at about 75% of transaction value, so any change in purchase behaviour moves the whole picture.
Why this project matters
This is the workflow a working data analyst follows. Start with a business question, choose the KPIs that answer it, build visuals that managers can filter and explore, and finish with conclusions that lead to action. At Bright Computer Education, students practise exactly this on real business datasets in Excel, SQL, Python and Power BI.