
Finding the profit leak: why ₹12M in revenue still ended in a ₹15M loss
Khushi turned raw business data into four Power BI dashboards that show exactly where the money went.
Power BI · Data Analytics Case Study
Khushi
Power BI project
The Business Problem
A smart-home products business sold devices such as Smart Bulb, Smart Plug, Smart Camera and Smart Lock across three categories: IoT, Security and Audio. On paper, 10 orders brought in about ₹12M of revenue.
Yet the books showed a net loss of ₹15M. The question Khushi set out to answer: where is the profit leaking?
What Khushi Built
Using Power BI Desktop, Khushi created four connected dashboards, each looking at the business from a different angle.
Project Snapshot
Student Khushi
Course Data Analytics
Batch 2026
Tool Power BI Desktop
Project Profit Leak Analysis
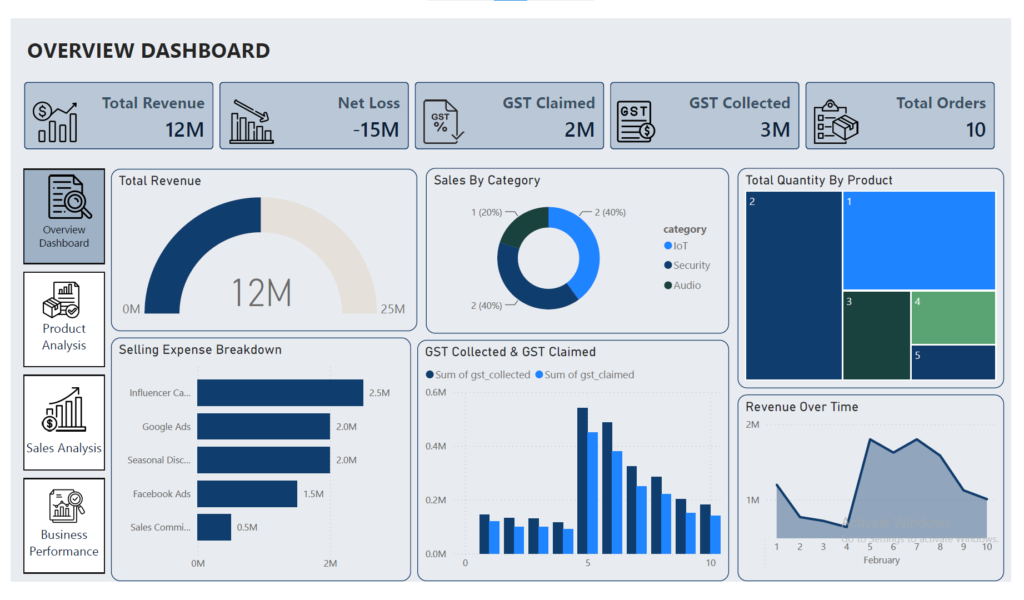
1. Overview. Revenue, net loss, GST and order count at a glance, plus selling expense breakdown.
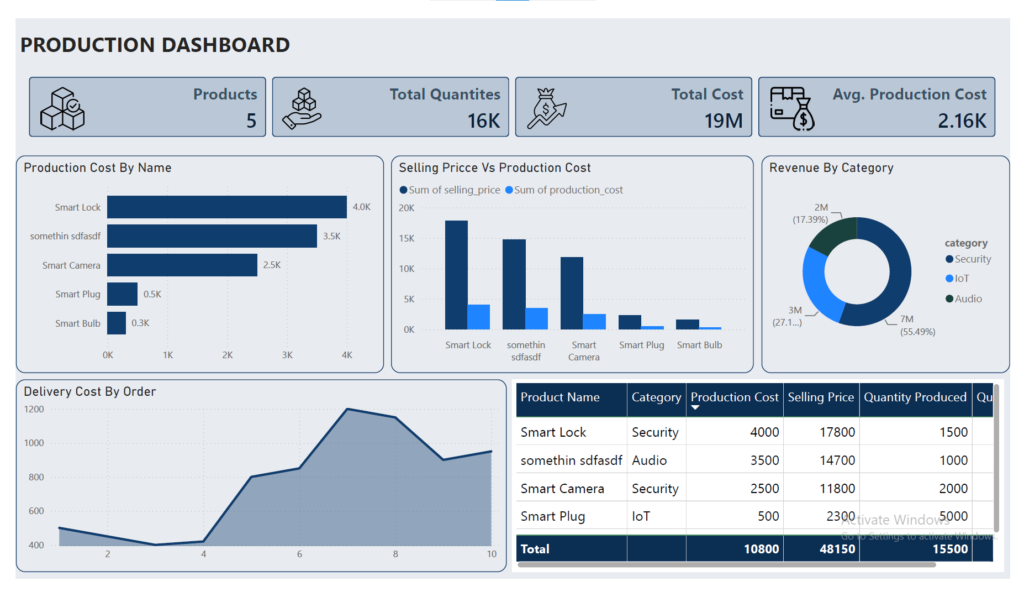
2. Production. Production cost per product against selling price and quantities produced.
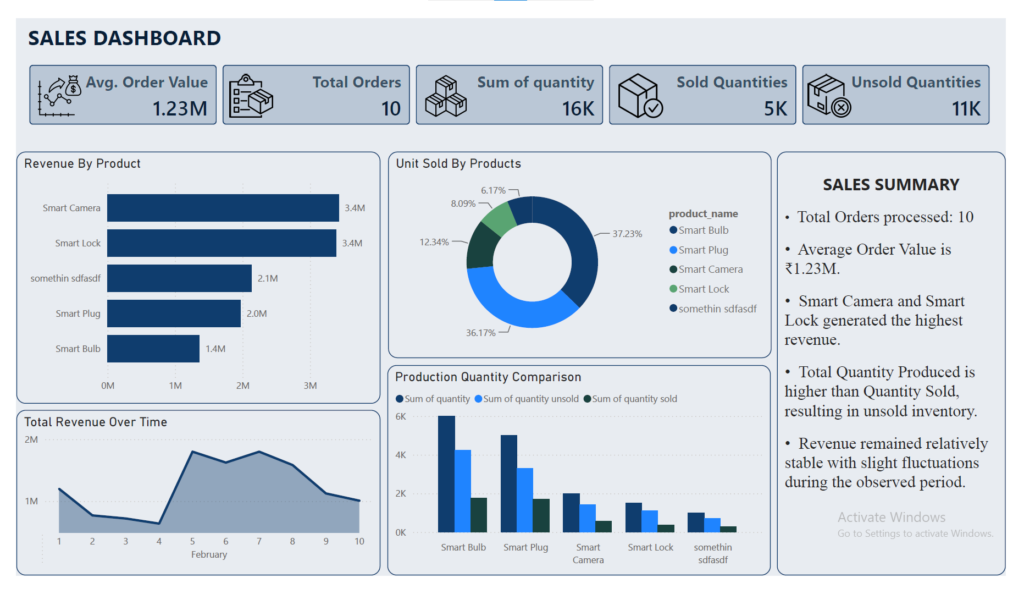
3. Sales. Revenue by product, units sold versus unsold, and average order value.
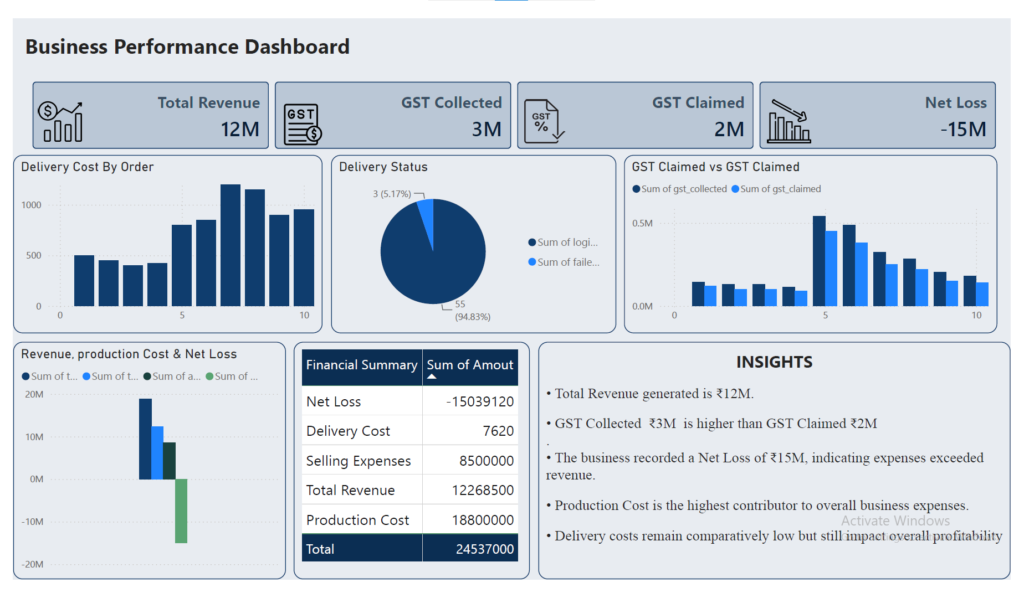
4. Business performance. Revenue against all costs, delivery status and GST collected versus claimed.
Key Findings
Production cost is the biggest expense.
₹18.8M of production cost against ₹12.27M of revenue means most products were not covering their own cost.
Marketing and discounts add ₹8.5M on top.
Influencer campaigns ₹2.5M, Google Ads ₹2.0M, seasonal discounts ₹2.0M, Facebook Ads ₹1.5M and sales commission ₹0.5M.
Most of the stock is unsold.
About 16K units were produced but only 5K were sold, leaving roughly 11K units of unsold inventory.
Smart Camera and Smart Lock lead revenue.
Each brought in about ₹3.4M, with an average order value of ₹1.23M across 10 orders.
GST and delivery are small by comparison.
GST collected (₹3M) is higher than GST claimed (₹2M). Delivery cost is only ₹7,620, low but still part of the loss.