
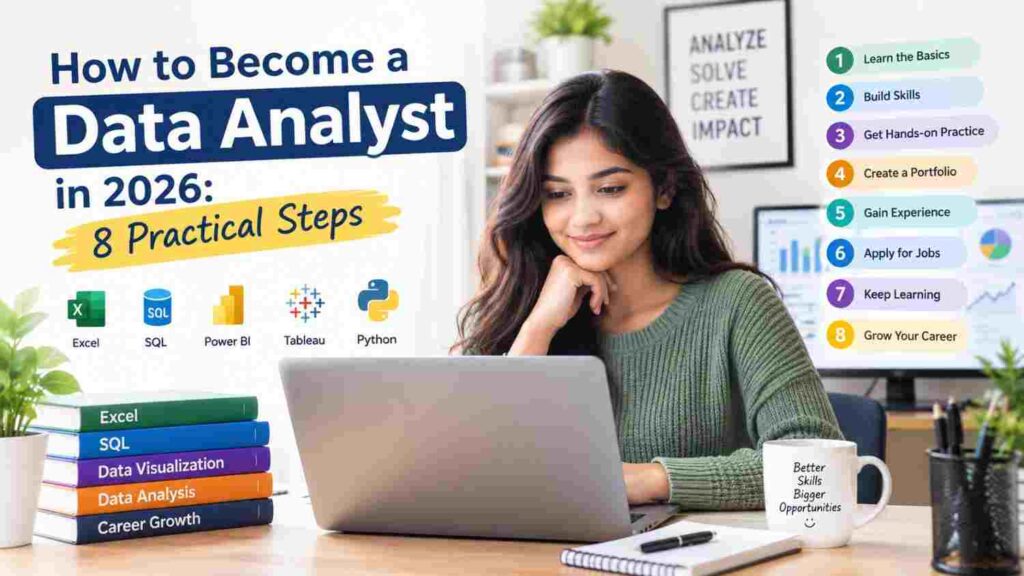
How to Become a Data Analyst in 2026: 8 Practical Steps
How to Become a Data Analyst in 2026: 8 Practical Steps
How to Become a Data Analyst in 2026– Every business now produces more numbers than anyone can read by eye. A shop in Alkapuri logs thousands of bills a month. A manufacturing unit near Makarpura records machine downtime every shift. A clinic tracks appointments, cancellations and repeat visits. Someone has to turn those records into answers, and that person is the data analyst.
If you are a student, a fresher, a commerce graduate or a working professional wondering how to become a data analyst in 2026, this guide is for you. It explains the job in plain terms, lists the eight steps that matter, gives a realistic timeline, and shows how to choose among the many computer courses in Vadodara without wasting months or money.
What does a data analyst actually do?
A data analyst collects data, cleans it, studies it and explains what it means so that someone can make a better decision. That is the whole job, and each part of it is a skill you can practise.
Consider a simple example. The owner of a coaching class in Vadodara wants to know why enrolments dropped in July. An analyst would:
- Pull enrolment records from the last two years.
- Remove duplicate and incomplete entries.
- Compare month-wise numbers, course-wise numbers and the source of each enquiry (walk-in, referral, Instagram, Google).
- Notice, for instance, that enquiries from referrals stayed steady while enquiries from online ads fell sharply.
- Present a short dashboard and a recommendation: review the ad budget and strengthen the referral offer.
No machine learning was needed. Most analyst work looks like this: a clear business question, tidy data, honest comparison, and a message that a non-technical person can act on.
Data analyst vs data scientist vs business analyst
These titles overlap, and job postings often mix them up. A rough guide:
| Role | Main focus | Typical tools | Entry difficulty |
|---|---|---|---|
| Data analyst | Answer business questions from existing data | Excel, SQL, Power BI or Tableau, basic Python | Moderate |
| Business analyst | Understand requirements and processes, link them to data | Excel, SQL, documentation tools | Moderate |
| Data scientist | Build predictive models and experiments | Python or R, statistics, machine learning | High |
For a beginner, the analyst route is the most practical door into the field. You can move toward data science later if you enjoy statistics and modelling.
Is data analytics a good career in 2026?
Short answer: yes, with a condition. The demand is real, but employers now expect proof of skill, not just a certificate.
Published salary guides for India in 2026 are not identical, since each uses a different data set, but they point the same way. Several of them put fresher pay at roughly ₹3.5 to ₹6 lakh per year, with stronger candidates (good SQL, Python or a BI tool, and real projects) reaching ₹6 to ₹8 lakh. One guide reports a national average near ₹6.9 lakh per year based on Glassdoor data from March 2026. Mid-level analysts with three to five years of experience are commonly listed between ₹8 and ₹18 lakh depending on city, industry and skills.
| Experience | Commonly reported range (per year) | What usually drives the offer |
|---|---|---|
| Fresher (0 to 1 year) | ₹3.5 to ₹6 lakh, higher with a strong portfolio | SQL, Excel, a BI tool, projects |
| Junior (1 to 3 years) | About ₹6 to ₹11 lakh | SQL plus Python or advanced BI |
| Mid-level (3 to 5 years) | About ₹10 to ₹18 lakh | Business knowledge and storytelling |
Treat these as ranges, not promises. Pay in Vadodara and the rest of Gujarat can differ from Bengaluru or Mumbai, and a service company will usually pay less than a product company. What the sources agree on is the pattern: SQL, Python and a visualization tool together earn noticeably more than any one of them alone, and a visible portfolio is what separates freshers who get shortlisted from those who do not.
The 8 practical steps to become a data analyst
Step 1: Understand the role and pick your starting point
Before opening any software, spend a week reading real job descriptions. Search “data analyst” on Naukri, LinkedIn and Indeed, filter for Vadodara, Ahmedabad and remote roles, and copy the required skills into a notebook. You will see the same words repeat: Excel, SQL, Power BI, Python, dashboards, reporting.
Then be honest about your starting point:
- Commerce or finance background: you already understand business numbers. Start with Excel and SQL.
- Engineering or science background: statistics and Python will feel natural. Spend extra time on communication.
- Arts or non-technical background: it is completely possible, but allow more time for Excel and basic maths.
- Working professional switching careers: use your current industry as an advantage. An HR person who learns analytics can become an HR analyst.
Step 2: Master Excel before anything else
Many beginners rush toward Python and skip Excel. That is a mistake. Excel is still the most widely used analysis tool in small and mid-sized Indian businesses, and it teaches you to think in rows, columns and formulas.
Focus on:
- Cleaning data: remove duplicates, fix text and date formats, handle blanks
- Lookup functions such as XLOOKUP or VLOOKUP, and conditional formulas like IF, SUMIFS and COUNTIFS
- Pivot tables and pivot charts
- Basic charts and conditional formatting
- Simple automation through named ranges and, later, macros
Practice tip: download a public sales data set, or use your own monthly expense sheet, and answer five questions from it using only pivot tables. If you can explain each answer in two sentences, you are on track.
Step 3: Learn SQL properly
SQL is the language used to ask questions of a database. It is the single most requested technical skill in analyst job postings, and it is easier than most people fear.
Learn in this order:
- SELECT, WHERE, ORDER BY, LIMIT
- Aggregations: COUNT, SUM, AVG, GROUP BY, HAVING
- JOINs (INNER, LEFT) across two or three tables
- Subqueries and common table expressions
- Window functions such as ROW_NUMBER and running totals
Install a free database such as MySQL or PostgreSQL on your own computer and build a small practice database with a student, course and payment table. Writing queries against data you designed yourself teaches more than copying solved examples.
Step 4: Build a statistics foundation
You do not need a maths degree, but you must understand what the numbers are telling you. Otherwise you will present confident-looking charts that are wrong.
Cover these topics:
- Mean, median, mode, and why the median often tells a truer story when a few values are very large
- Standard deviation and spread
- Percentages, percentage change and weighted averages
- Correlation, and why it does not prove cause
- Sampling and basic ideas behind A/B testing
- Reading distributions and spotting outliers
A useful habit: whenever you see a headline statistic, ask three questions. What was measured? How many were measured? Compared with what?
Step 5: Add Python for analysis
Python becomes valuable once Excel and SQL feel comfortable. Its job in analytics is to handle larger files, repeat tasks automatically and go deeper into exploration.
You only need a focused slice of the language:
- Basics: variables, lists, dictionaries, loops, functions
- pandas for loading, filtering, grouping, merging and cleaning tables
- NumPy for numerical operations
- matplotlib or seaborn for charts
- Jupyter Notebook for writing analysis that others can read top to bottom
Skip advanced topics such as web development or deep learning at this stage. A beginner who can clean a messy CSV file in pandas and produce three clear charts is already employable for many entry-level roles.
Step 6: Learn a visualization tool (Power BI or Tableau)
Numbers that nobody understands change nothing. A BI tool lets you turn tables into interactive dashboards that managers can open and explore.
Power BI is a sensible first choice for most learners in India because it is widely used in banking, IT services, manufacturing and retail reporting. Tableau is also in demand, especially in product companies. Pick one, learn it well, and understand the other later.
Skills to build:
- Connecting to Excel, CSV and SQL sources
- Data modelling: relationships between tables
- Measures and calculated columns (DAX in Power BI)
- Choosing the right chart: bar for comparison, line for trend, scatter for relationship
- Dashboard layout: the most important number should be the first thing the eye sees
Quick test for a good dashboard: hand it to someone outside your field and ask what they learned in thirty seconds. If they cannot answer, simplify.
Step 7: Build three portfolio projects
This is the step that separates applicants. A recruiter reviewing fifty fresher profiles cannot tell who is skilled from a list of tools. A link to three clear projects shows it in minutes.
Aim for variety, so you show the full workflow from question to recommendation:
| Project idea | Skills shown | What to deliver |
|---|---|---|
| Sales analysis for a retail or restaurant data set | Excel, SQL, Power BI | Dashboard plus a one-page summary of findings |
| Customer or student enrolment analysis | SQL, Python (pandas), statistics | Notebook explaining trends, drop-off points and suggestions |
| Local-interest project, for example monthly electricity, rainfall or fuel-price trends in Gujarat from public data | Data cleaning, charts, storytelling | Short written report with 4 to 5 charts |
For every project, write a short README that states the business question, the data source, the method, three findings and one recommendation. Host the work on GitHub or a simple portfolio page. Do not use the same famous practice data sets that thousands of other candidates submit; at least one project should use data you collected or cleaned yourself.
Step 8: Prepare your resume, practise interviews and start applying
By now you have the skills. This step is about presenting them.
Resume:
- Keep it to one page for a fresher
- List projects with a measurable result (for example, “reduced a 12,000-row sales file to a 5-page dashboard that highlighted the three weakest product lines”)
- Place tools in a clear skills section, but let projects carry the weight
- Add a link to your portfolio
Interview preparation:
- Practise explaining one project aloud in two minutes
- Solve SQL problems on paper or in a plain text editor, without autocomplete
- Be ready for case-style questions: “Sales fell 15 percent last month. How would you investigate?”
- Revise basic statistics terms and be able to explain them to a layperson
Applying: use a mix of job portals, company career pages, LinkedIn connections and local networks. Internships and short contract roles are an excellent way in, because experience on a real team often matters more than the first job title.
A realistic learning timeline
How long does it take? It depends on the hours you can give and your background. A reasonable plan for someone studying about 10 to 12 hours a week:
| Phase | Duration | Focus |
|---|---|---|
| Month 1 | 4 weeks | Excel and basic statistics |
| Month 2 to 3 | 8 weeks | SQL, with daily practice queries |
| Month 3 to 4 | 6 weeks | Python with pandas, plus visualization basics |
| Month 5 | 4 weeks | Power BI or Tableau, first dashboard |
| Month 6 to 7 | 8 weeks | Three portfolio projects |
| Month 7 to 8 | 4 to 6 weeks | Resume, mock interviews, applications |
Full-time learners can often compress this into four to five months. The timeline is a guide, not a rule. Finishing a step properly is better than finishing it fast.
Learning in Vadodara: classroom, online or both?
Self-study with free videos works for disciplined learners, but many people stall because they have no one to check their work or answer a stuck question at eleven at night. That is where structured training helps.
When you compare computer courses in Vadodara, or look at any data analyst course in Vadodara, use this checklist before paying:
- Syllabus depth: does it cover Excel, SQL, statistics, Python and a BI tool, or only one or two?
- Hands-on practice: are you working on real data sets in every session, or just watching slides?
- Projects: will you leave with projects you can show, and will someone review them?
- Trainer access: can you ask doubts easily, and are batch sizes small enough for individual attention?
- Schedule flexibility: are there weekday, weekend and evening options if you are studying or working?
- Career support: is there help with resume building, interview practice and portfolio review?
- Honest promises: be careful with institutes that guarantee a job or a fixed salary. No one can promise that, and a good institute will not.
Visit the centre, sit in a demo session if one is offered, and ask to see sample student work. Location also matters in a city like Vadodara, because a long commute twice a week wears down motivation faster than most people expect. Many learners choose a centre near Sayajiganj, Alkapuri or Race Course so that classes fit around college or work.
Bright Computer Education is one of the Vadodara institutes that run a data analytics track. Its course page lists modules that follow the same path as this guide: Excel, SQL, statistics, Python, data cleaning and exploratory analysis, Power BI, data visualization, real-world projects, and interview and portfolio preparation. Check the current syllabus, duration and batch timings directly with the institute, because details are updated from time to time. You can read more on the Data Analyst Training in Vadodara page.
Local advantage: why Vadodara and Gujarat are a good place to start
You do not need to move to a metro to build an analytics career. Vadodara and the wider Gujarat belt have a mix of employers that all need reporting and analysis:
- Manufacturing and engineering units around the city’s industrial areas need production, quality and inventory analysis.
- Chemicals, petrochemicals and pharmaceuticals companies in the region rely on batch, yield and compliance data.
- Banks, NBFCs and insurance firms use analysts for collections, risk and customer reports.
- Retail, education and healthcare businesses have growing needs for sales, enrolment and patient-flow analysis.
- IT and BPO teams, along with remote roles from other cities, offer further openings.
A practical tip for local applicants: when you build projects, try to use sector examples from these industries. A dashboard on, say, machine downtime or monthly stock movement tells a Vadodara hiring manager that you understand the businesses around you.
Common mistakes beginners make
- Collecting certificates instead of building projects. Certificates help, but a recruiter learns far more from a project they can open.
- Learning ten tools shallowly. Master Excel, SQL and one BI tool before adding anything else.
- Skipping data cleaning. Real data is messy. Most of an analyst’s time goes into preparing it, so practise on dirty files, not only tidy examples.
- Making charts without a question. Start with the question, then choose the chart.
- Ignoring communication. Practise writing a three-line summary of every analysis you do.
- Waiting to feel “ready”. Apply once you have two good projects. You will learn the rest on the job.
Frequently Asked Questions
To become a data analyst in 2026, learn Excel, SQL, statistics, data visualization, and tools such as Power BI or Tableau. Build practical projects and create a strong portfolio to demonstrate your skills.
Important data analyst skills include Excel, SQL, statistics, data cleaning, data visualization, Power BI or Tableau, problem-solving, and communication.
Yes. A relevant degree can be helpful, but practical skills, certifications, projects, and a strong portfolio can also help you start a career in data analytics.
Basic coding is not always required for entry-level data analyst roles. However, learning Python can help with data cleaning, automation, analysis, and handling larger datasets.
Start with Excel and SQL, then learn a visualization tool such as Power BI or Tableau. Python is also useful for advanced data analysis and automation.
The time varies depending on your background and learning schedule. With consistent practice, beginners can build foundational data analytics skills within a few months.
Include practical projects that demonstrate data cleaning, analysis, visualization, and business insights. Projects using Excel, SQL, Power BI, or Python can make your portfolio more useful.
Work with real-world or publicly available datasets. Practice cleaning data, writing SQL queries, creating dashboards, identifying trends, and presenting your findings.
Data analytics can be an accessible career path for beginners who enjoy working with data, solving problems, and learning analytical tools.
Data analysts generally focus on analyzing existing data, creating reports, and finding business insights. Data scientists typically work with more advanced statistics, machine learning, and predictive models.
Certifications in areas such as Excel, SQL, Power BI, Tableau, or data analytics can demonstrate your skills. Choose certifications that match your career goals and include practical learning.
Final Thoughts
Becoming a data analyst is less about secret talent and more about steady, ordered practice: Excel first, then SQL, statistics, Python, a visualization tool, and finally projects that prove what you can do. Follow the eight steps, keep your learning focused, and build work you are proud to show.
If you prefer guided learning with trainers, practical sessions and project support, explore the data analytics programme at Bright Computer Education in Vadodara, visit the centre, and compare it against the checklist above. Choose the path that fits your schedule and goals, then start this week with a single Excel file and one honest question.
Salary figures in this article are drawn from publicly available 2026 salary guides and vary by source; confirm current numbers on job portals before making decisions.